Updating your Java server in runtime

It is sometimes convenient to have the ability to update an application in runtime. You might want to change the log level to track down some bug or maybe change the setting of a feature toggle. But it’s difficult to redeploy the application without disturbing your users. What to do? At SpeedLedger we decided to put the properties we want to change in runtime in a file on disk outside of the application. We then let our application watch the file for changes using Java’s java.nio.file.WatchService. So whenever a property in the watched file is changed the application is automatically called to update its state. We currently use it to add new endpoints in our traffic director.

Doing this first appeared to be really simple, the functionality is built in to Java since version 7. But doing it in a stable and controlled way required some thought, you cannot have your file watch service crash your application in production. So we created a small helper class to hide the complexity and decided to open source it. The code is available on GitHub.

To use it, simply add this dependency to your pom (or similar):

<dependency>
   <groupId>com.speedledger</groupId>
   <artifactId>filechangemonitor</artifactId>
   <version>1.1</version>
</dependency>

To create a new file watch you can do something like this when your application starts:

public class MyFileWatcher {

   final static String CONFIG_HOME = "/home/speedledger";
   final static String CONFIG_FILE = "file.json";

   public void init() {
      FileChangeMonitor monitor = new FileChangeMonitor(CONFIG_HOME, CONFIG_FILE, this::updateSettingsFromFile, 30);
      new Thread(monitor).start();
   }

   void updateSettingsFromFile(String directory, String file) throws IOException {
      ObjectMapper mapper = new ObjectMapper();
      String json = new String(Files.readAllBytes(Paths.get(CONFIG_HOME + File.separator + CONFIG_FILE)), "UTF-8");
      List<Endpoint> endpoints = mapper.readValue(json, mapper.getTypeFactory().constructCollectionType(List.class, Endpoint.class));

      // Update the endpoints
   }
}

In this example we watch a JSON file containing “endpoint” objects. Whenever someone writes to the file updateSettingsFromFile is called and the endpoints are read from the file and updated. If something goes really wrong, like the disk becomes unavailable or someone deletes the watched directory, the monitor waits for 30 seconds and then tries to restart the watch service.

It is a good idea to validate the data from the file before updating, if someone makes a mistake when editing the file we want to keep the current state and log an error message.

Note that if you run this on OS X you will notice a substantial (a few seconds) delay in the watch. This happens because Java on OS X doesn’t have a native implementation of WatchService. This shouldn’t be a problem as long as your don’t use OS X in production.

The file change monitor is available on GitHub and Maven Central, we hope you will find it useful!

alt text

Docker is live!

Finally we have come to the point where we have started using Docker containers in our production systems. We have already used the lightweight container platform for smaller applications and now we have rolled it out for our flagship product in production as well.

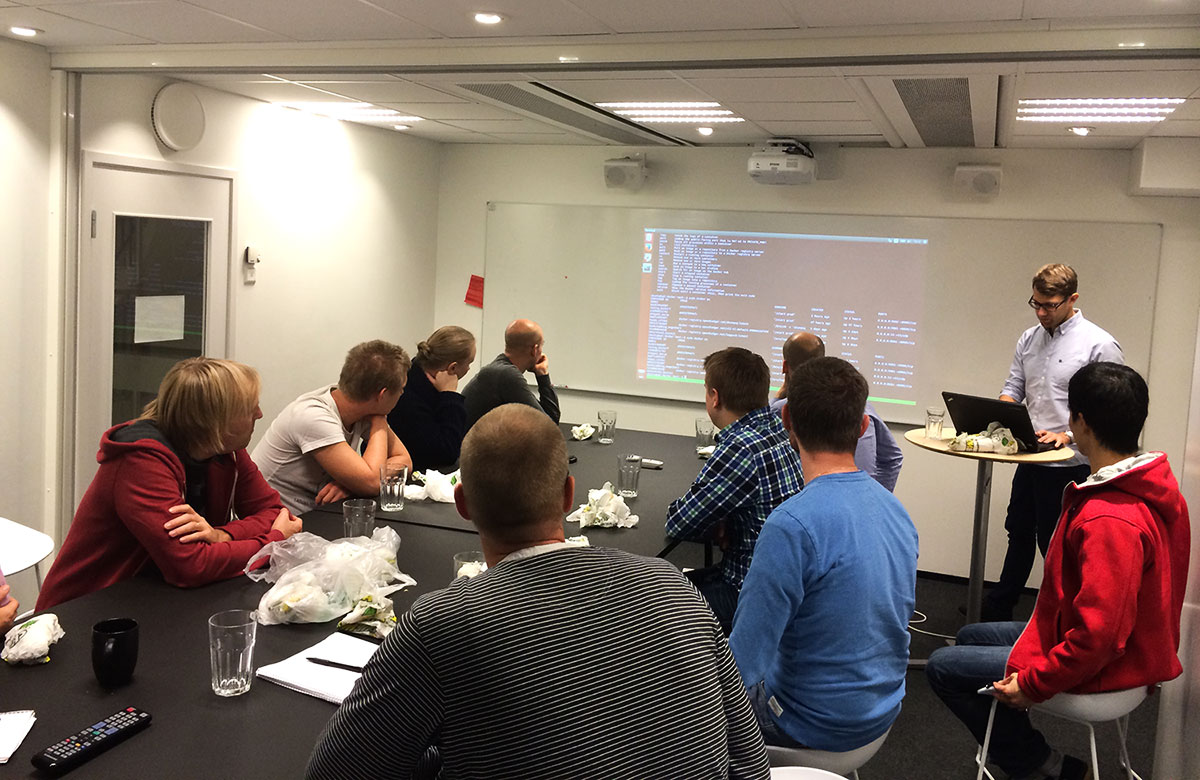
A couple of days ago we had a internal brown-bag-lunch showing off what we have achieved so far. Both teams have been involved in discussing the new infrastructure and now we have rolled it out for 10% of our users. The following days we will monitor the new instance and hopefully ramp up to 100% load.


The primary incentive for containerizing our production environment was to achieve zero-downtime deployments. As we were keen on moving away from the old production environment, creating yet another Tomcat instance was not an option.

By using Docker we have drastically changed our production environment. It now has the following nice characteristics.

Everything is version-controlled

We now have fine grained control and history of how our production environment changes over time.  Also, we know where to look when a question comes up about our production environment; our source code repository. A new employee can easily understand and gain an overview of the production environment setup.

Light-weight environments

Docker containers are really fast to spin up and a container does not consume the same amount of resources as a plain old VM with Guest OS. This enables  us to create small and designated containers with a single purpose, as opposed to our old production environment where all services run on the same machine. “Separation of Concerns” ftw!

Reproducible production environment

Since an image is portable and guaranteed to work the same way whichever host it is running on, we can easily reproduce the production environment. This eliminates a lot of uncertainties that are present when you troubleshoot a production error.

Next steps

Using Docker in production is an important milestone. More importantly, it enables us to proceed with many other improvements.

Continuous Integration build

We are starting to make use of commands we created to automatically build and push Docker images on CI (We are trying out Bamboo).

mvn clean install -PbuildDockerImage,pushDockerImage

Our build runs a lot of integration tests that require an Oracle database. Using Docker, we are able to spin up an Oracle container on start, run our build (including integration tests) and finally stop the database container in three well defined steps in our build cycle.

Deployment tool

We are in the middle of developing a new deployment tool, called “Haddock”. It will help us automate a lot of deployment steps that we currently perform manually. Haddock takes a tag of the image we want to release, communicates with the Docker daemon on the host we want to spin up a new production instance and asks the Service Locator to direct traffic to it. We are in the middle of extracting some logic from our proxy into a service locator like app. The proxy will only direct new traffic to the new instance since we need sticky sessions for our running clients. When all client sessions have expired, we can remove the old instance from production without downtime for users.


We are really excited about our new production environment we can not wait to start utilizing our new infrastructure for a Continuous Deployment scenario. This is just the beginning…


Counting Stories

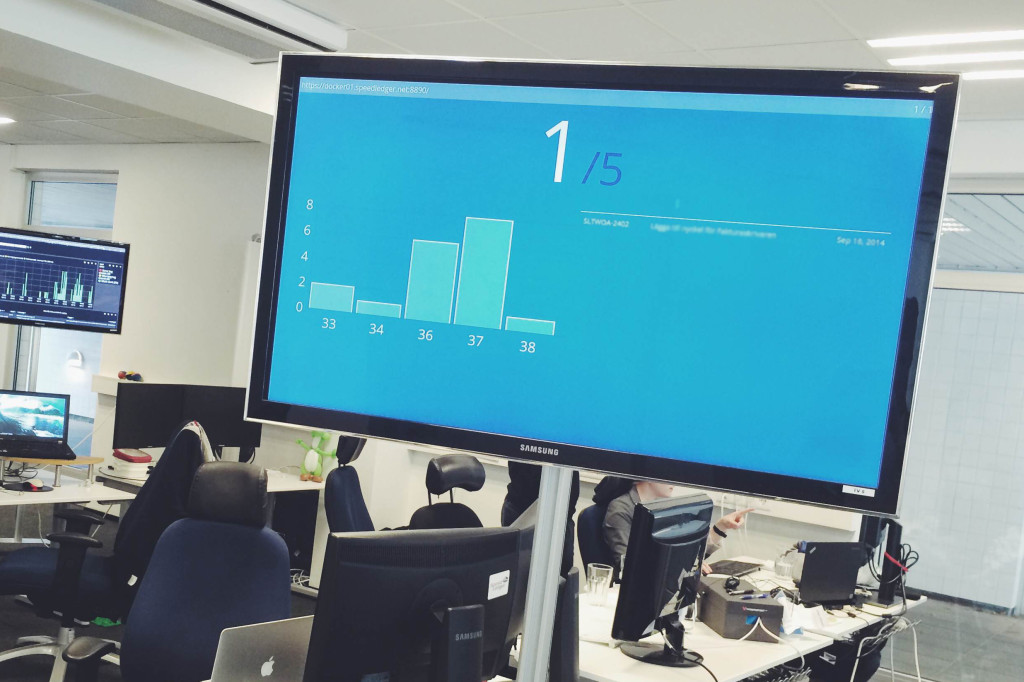
A few weeks ago, we started measuring our development performance in a new way. We simply count the number of completed stories (stories with business value only) and track this number over time. We are firm believers in the psychological effect called “You get what you measure”, i.e. when you start to measure some metric and make it very visible, it will converge to the desired value over time. To achieve this effect and to help us focus on the story pace, we have installed monitors in our team room that display our current pace at all times.

One of our team monitors showing the number of stories closed so far the current week (week 38). The number 5 is the current weekly goal.

One of our team monitors showing the number of stories closed so far the current week (week 38). The number 5 is the current weekly goal.

Just counting the number of stories without using story points or any kind of estimation may seem like a crude strategy, but we think it will have some really nice benefits and we are excited and anxious to evaluate the experiment over time.

A sceptic may react to this strategy by saying: That’s silly, you just have to make less work in each story and you will get a higher score!

This is very true. And also very advantageous! It creates a win-win situation in which we get the story pace metric for tracking purposes, and a mechanism/incentive to decrease the size of our stories. Smaller stories provide a better flow, more frequent feedback, and less waste. (To name just a few benefits)

So, how long can we rely on this mechanism? Well, if we are successful at decreasing the story size continually, the number of stories per unit of time will increase. Eventually, the overhead of switching between stories will become too costly (percentage-wise). To achieve an even higher story pace at this point, we will have to focus on our tools and processes to reduce the overhead. As a result, we go from win-win to win-win-win: By introducing the story pace metric, we get the metric itself, an incentive to create smaller stories, and finally a mechanism that incentivises us to streamline our process and our tools.

This advantageous spiral may – in theory – go on forever. However, some kind of practical equilibrium will probably settle after a few cycles. At this point we will have become experts at slicing our stories into super thin slices and and also at streamlining/automating our process. We will have a nice high throughput of quality work, but we will also have something that may be even more desirable than a high pace: A predictable pace. Our product owners are going to love us! (Even more…)

All of the above is of course only our theory/hypothesis. We are looking forward to the coming months to see if we can pull it off in practice!

Containers for test environments using Docker

We have started moving all our internal services from our local servers to cloud based. One big part of that job is to move all test environments. We took the opportunity to the revise that infrastructure. Before, our environments were pretty much static. One Tomcat per application and communication between them was set up in the products configuration modules. One ActiveMQ instance with a lot of environment prefixed queue names to communicate between applications. A pretty messy setup actually.

As long as we had a sufficient number of environments we could deploy new versions quite easily. The obvious problem is that the number of environments increase and that it requires manual steps to spin up a new environment.
Another flaw is that the test environment also differs too much from the production environment since multiple test environments run on the same host. And what about the production environment. How is it set up? Well, we have documents describing the packages needed, firewall configuration, applications’ locations and so on but none of these are 100% accurate.

Docker to the rescue

We do not want to have a limitation on the number of test environments we can run. We want our environment configuration (installed packages, scripts, configuration files, environment variables etc) to be versioned in a VCS. Setting up a new environment must go fast!

Marcus Lönnberg recommended Docker after using it quite a while. Docker is a Linux container engine with means to do lightweight virtualization. Images are built and can be used in any Linux environment compatible with Docker. Images are built hierarchical on top of each other which enables image reuse and avoids configuration duplication.

We run a private repository for our Docker images where we can push updated and new images to and pull down images from. All our Docker files and image build scripts are kept in Git, so all changes made to our environments are version controlled in contrast to the mutable production environment we are running today.

We have just started using Docker and completed our first story that enables us to create a new test environment involving four containers.
  • ActiveMQ
  • SpeedLedger accounting system (app container)
  • Login and proxy (app container)
  • Database
These containers constitute one test environment. They are tied together when started by giving them links to each other. That way the containers can use link names to communicate. This is how we start up a new test environment currently.
lis@lis-vm:~$ cat launch-test-environment
#!/bin/bash

NAME_POSTFIX=<code>date +%Y%m%d-%H%M%S</code>
DB_NAME="oracle_$NAME_POSTFIX"
JMS_NAME="activemq_$NAME_POSTFIX"
APP_NAME="accounting_$NAME_POSTFIX"
PROXY_NAME="proxy_$NAME_POSTFIX"
set -e

IMAGE_PREFIX=docker-registry.speedledger.net

echo $DB_NAME
docker run -t -d -p 1521 --name $DB_NAME $IMAGE_PREFIX/oracle-xe:sl

echo $JMS_NAME
docker run -t -d --name $JMS_NAME $IMAGE_PREFIX/activemq

echo $APP_NAME
docker run -t -d \
--name $APP_NAME \
--link $DB_NAME:oracle \
--link $JMS_NAME:activemq \
$IMAGE_PREFIX/accounting:ea6757a8090d

echo $PROXY_NAME
docker run -t -d -p 8080 \
--name $PROXY_NAME \
--link $DB_NAME:oracle \
--link $APP_NAME:accounting \
--link $JMS_NAME:activemq \
$IMAGE_PREFIX/proxy:d277d11f1376
 
We build up our containers in a hierarchy where ubuntu is the base image. App container docker files reside in each app’s repository.

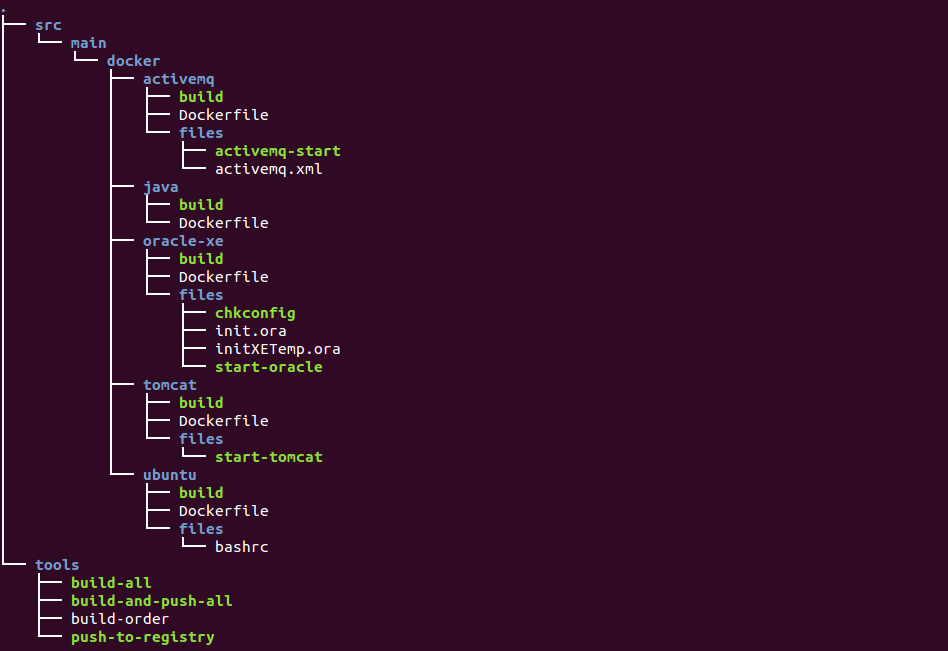
All other images are built up by source in a separate repository. Below is a snapshot of the current source structure of that repository.
build_containers_tree

Every time Jenkins builds our applications we plan to build a new image identified by application VCS changeset branch and hash. This image is based on a tomcat image and has the newly built war file contained. The image is then pushed to our docker registry and ready to be pulled down when spinning a test environment. We might just do that automatically for every change until we see that the number of concurrent test environments is unreasonable high. The big advantage is of course always having a test environment ready without even pushing a button in Jenkins.

To avoid having too many containers up and running at the same time we will probably have a monitoring application that stops running containers if they have not been used for some period of time.

Using it in production

So far we only use containers for test environments. A nice side effect by running lightweight containers in the cloud is that we could quite easily turn a test environment into a production node given an infrastructure that supports multiple simultaneous production environments with a controller in front registering existing environments. We simply have to switch out the database link for the app containers and direct some amount of traffic to it.

By monitoring our environments we could make sure an environment with high error rate automatically would be stopped and stop traffic to it. A successful new environment (zero errors) would be given more and more traffic until old versions are out of service and a new environment is starting up. Realistically we would hava a couple of different versions up and running as our stories are completed, automatically built by CI and pushed to production. As we are committed to increase our team velocity and decrease cycle time, more and more stories will be completed per time unit. That implies an increasing number of production deploys and probably more concurrent running environments.

I have seen some variants of this architecture in presentations given by Twitter and Netflix. Netflix announced Asgard  as Open Source back in 2012.

This is our plan to solve the problem with having a static type of test environment infrastructure. It would be interesting to hear about your experiences. How do you address the complexity of having n test environments?


Maker Days

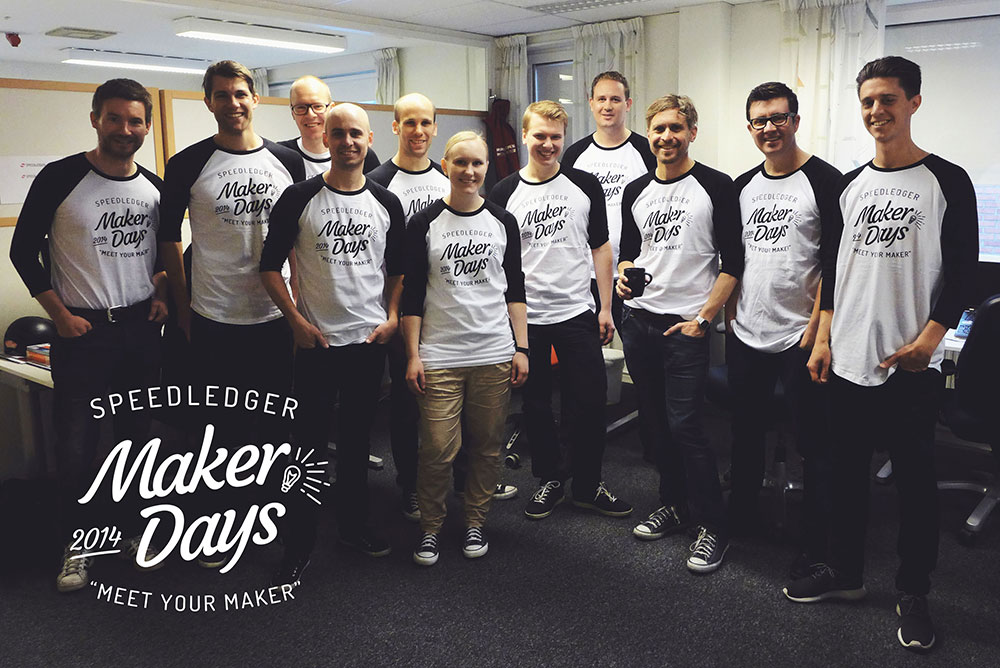
Maker Days 2014 Q2

Last week we pulled off our first hackathon! Take a look on what and how we did it!

Starting the Tech blog

Welcome to SpeedLedger’s Tech blog. Our intention is to increase SpeedLedger Engineering transparency by blogging about what we are doing.

I hope you will find our posts interesting. Please share your opinion with us!