The day after creating the Docker Göteborg Meetup group, around 30 members had joined. Now the are 65 Dockers in the group. The interest and buzz about Docker is intense for sure.
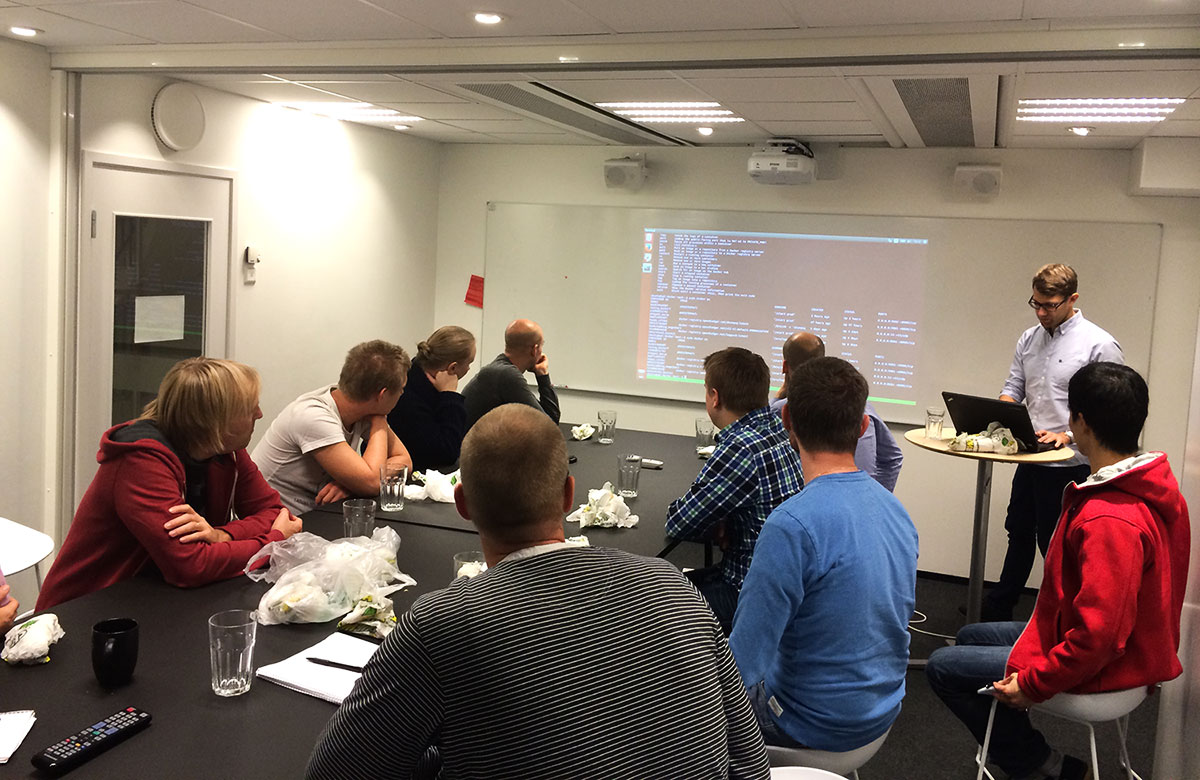
We started the group 21th of October this year and we decided to start off with a introduction meeting. It felt right to have a small group of people (20) and focusing on discussions instead of presentations. Here follows a brief summary of the meeting.
Short introduction of all participants
Everybody introduced themselves. The DRY principle was heavily applied since some people worked at the same company =)
Group introduction
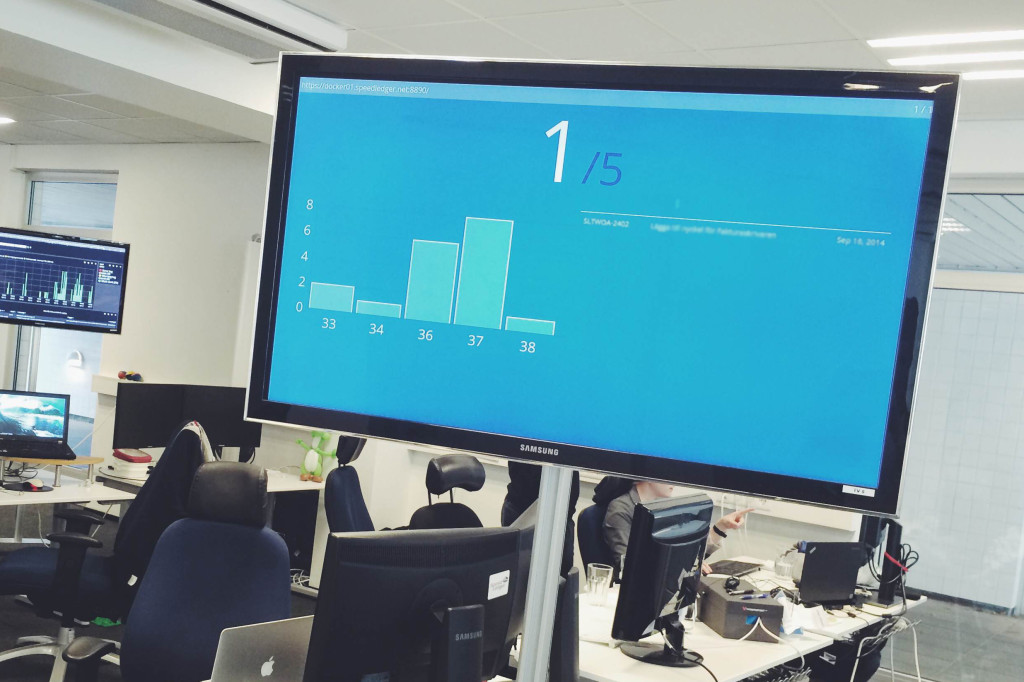
Me and Marcus Lönnberg (the group organizers) are working at SpeedLedger and we started using Docker at SpeedLedger half a year ago. We started to use Docker for some of our internal services and single purpose production services. When we were in the starting blocks of putting Docker in to use on our flagship product we felt the need to discuss Docker topics in a bigger forum. Hence the meetup group. We also have a co-organizer Katya from Docker who offered her help.
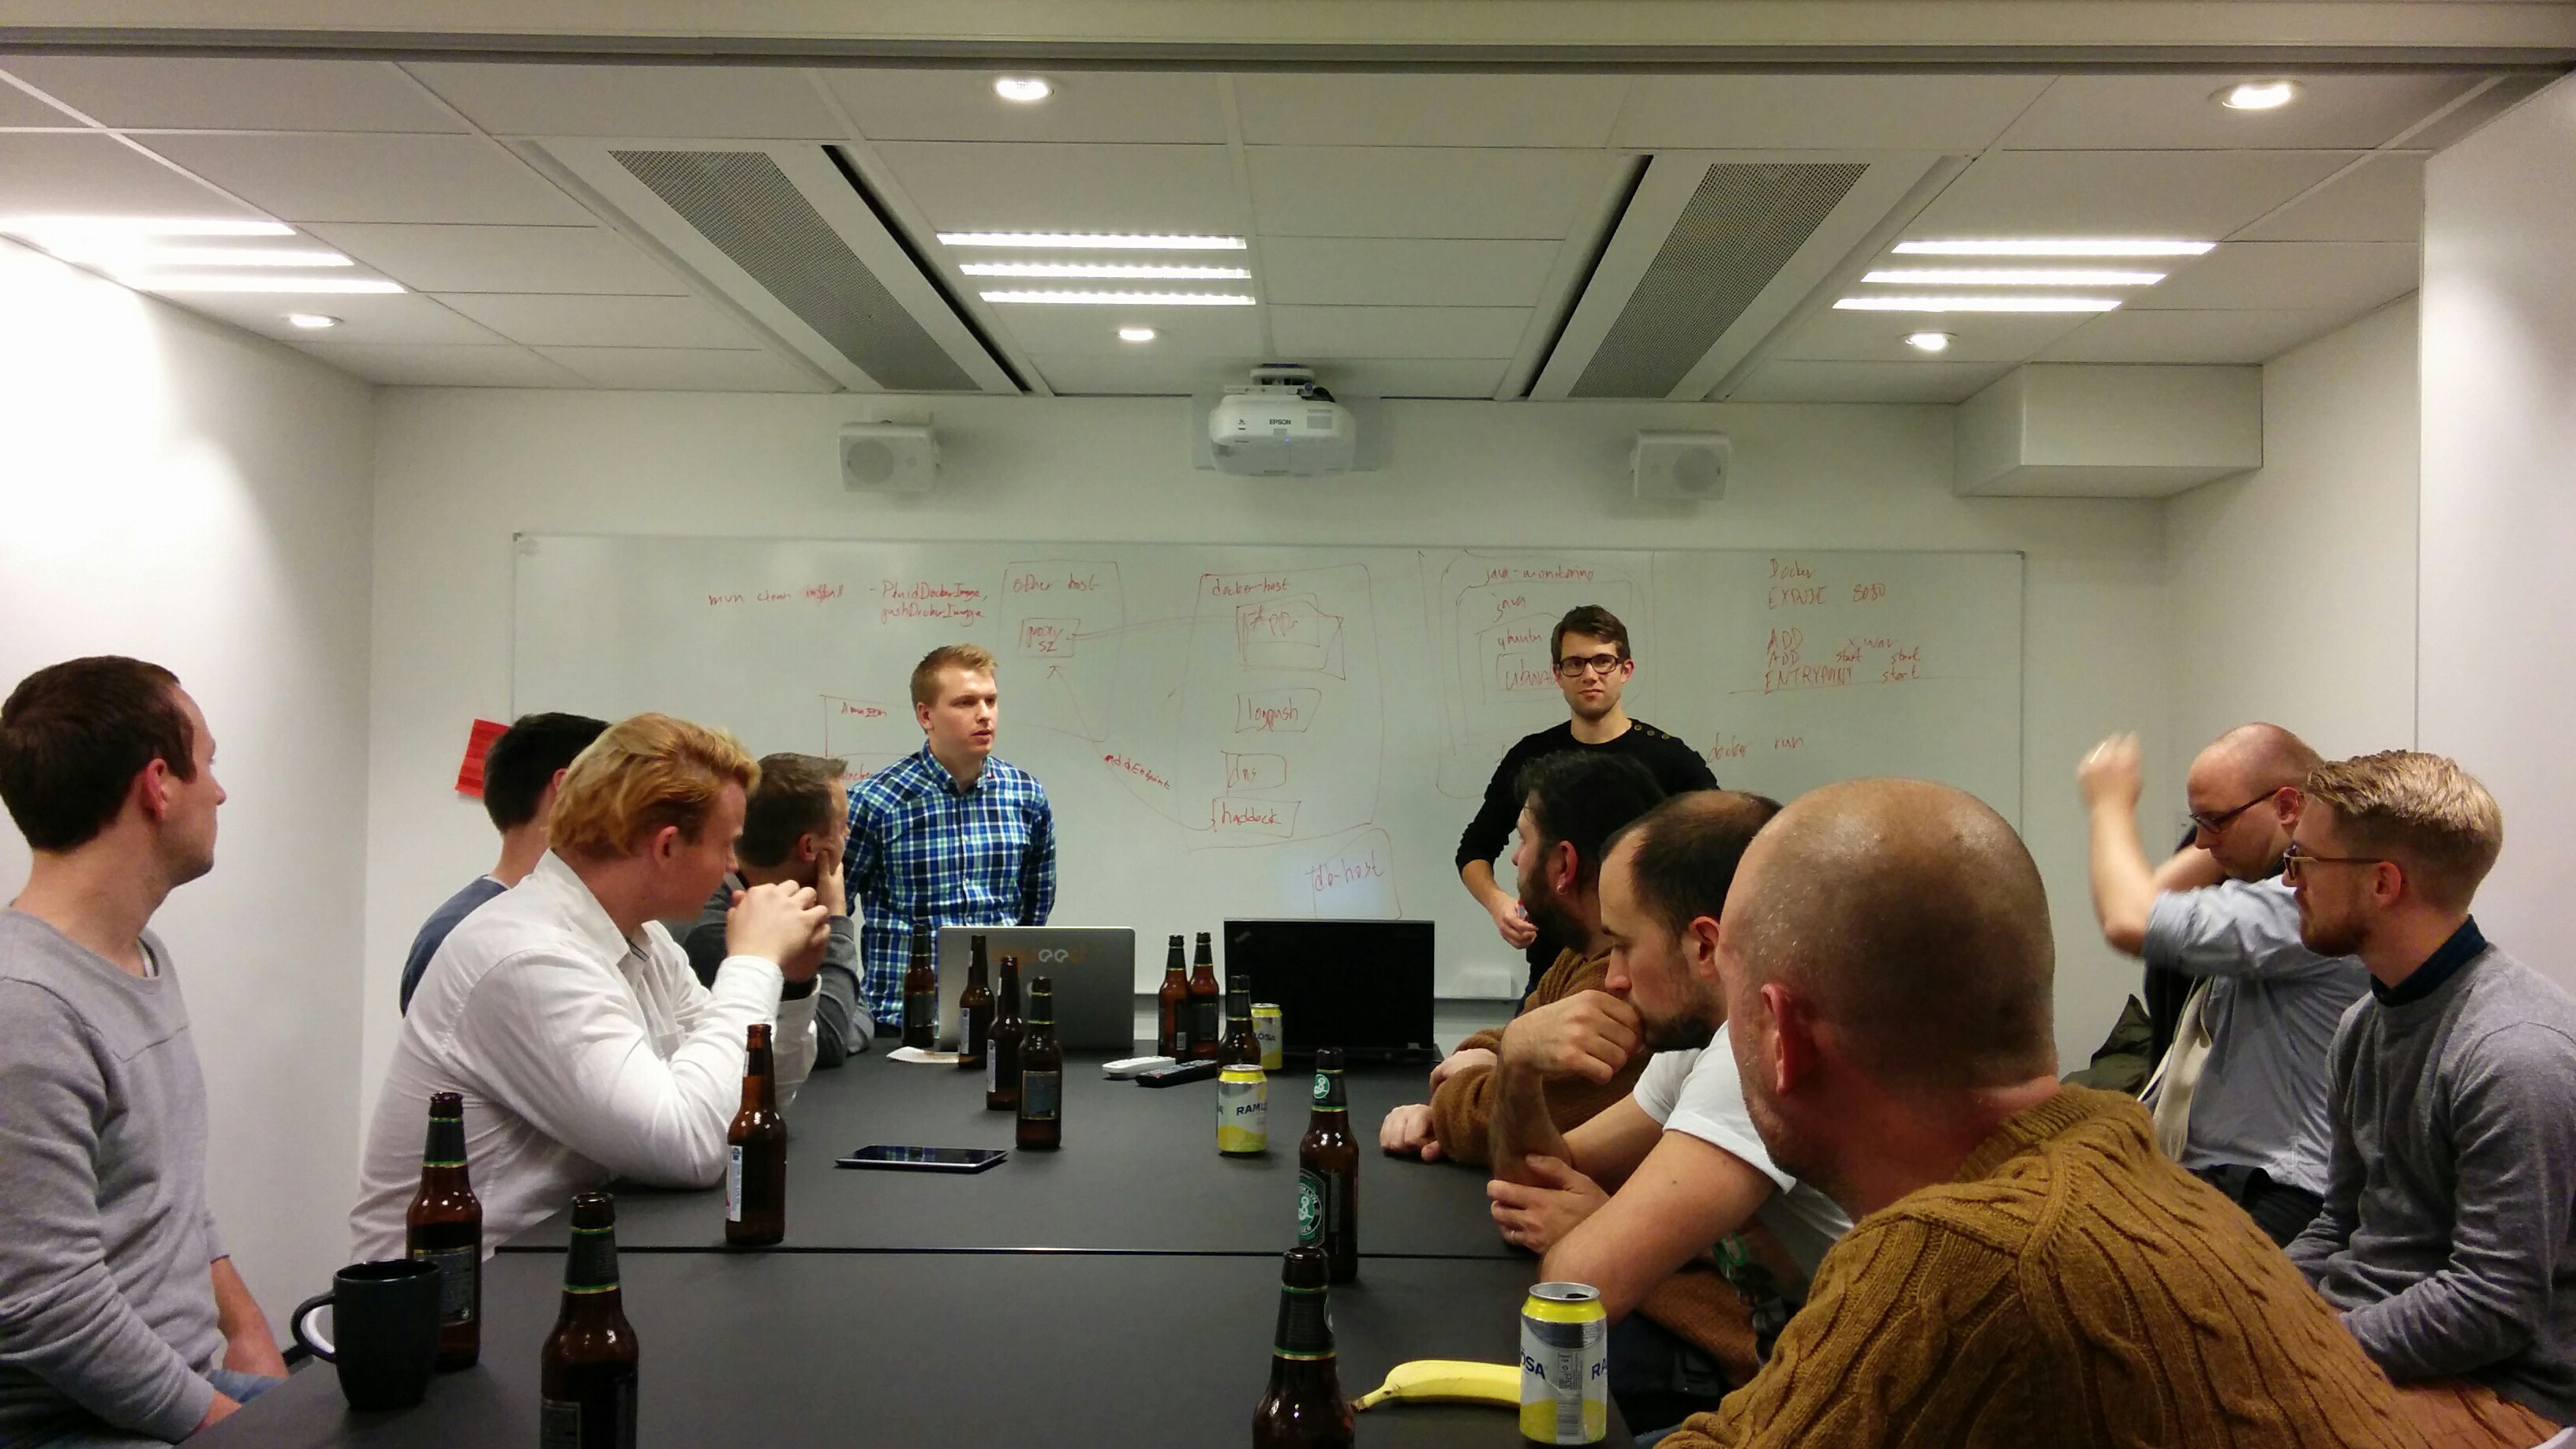
Leading presentation and discussion
We started by defining Docker together by writing down properties and characteristics. Most of them were positive but also some negatives were addressed. We moved on and started talking about how we are using Docker at SpeedLedger. We draw our production environment and a lot of question came up. These were some of the questions:
“How are you coping with docker host updates?”
“Where do you keep configuration? Inside or outside container image?”
“How do you communicating between containers?”
“How is the new production environment working out? Problems?”
“How do you deploy new images?”
etc.
A lot of good questions and interesting ideas. To summarize, the majority of the participants are not using Docker in production yet. Some are using it for other purposes such as test environments though.
What now?
We talked about practicalities around the next meetup. We will surely try to gather many more participants for the next meetup in order to involve and attract as many people as possible to the group. Seems like the next meetup would gain popularity by doing having more in-depth presentations. Lets see how that turns out!
Right now I am in Amsterdam and looking forward to attend the DockerCon Europe 2014 conference. If you want to see what comes out of it, follow me on Twitter and continue to follow this blog…
Take care folks!
Recent Comments